June 30, 2023
Neiman Institute Fiscal Year 2022 Annual Report
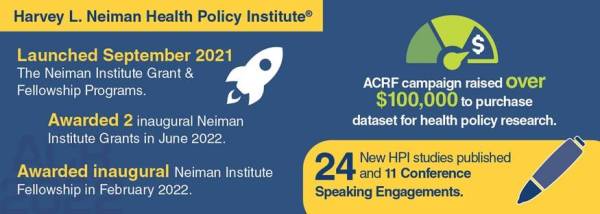
FY 2022 (July 01, 2021 – June 30, 2022) Top Accomplishments
The mission of the Harvey L. Neiman Health Policy Institute® is to establish foundational evidence for health policy and radiology practice that promotes the effective and efficient use of health care resources and improves patient care.
June 30, 2023
FY 2022 (July 01, 2021 – June 30, 2022) Top Accomplishments
November 7, 2022
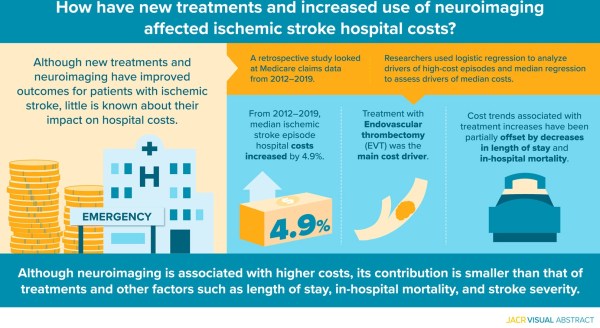
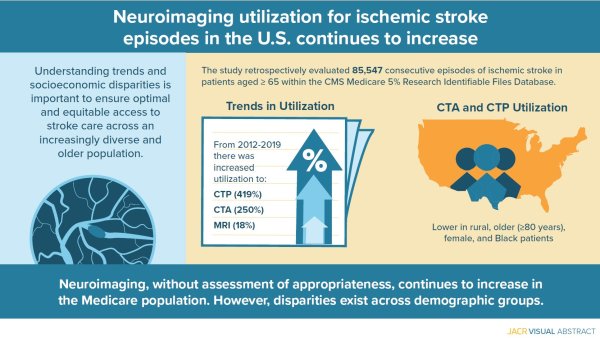
The increased use of neuroimaging and innovations in ischemic stroke (IS) treatment have improved outcomes, but the impact on median hospital costs is not well understood. The JACR retrospective study was conducted using Medicare claims data for 75,525 consecutive index IS hospitalizations for patients aged ≥65 years from 2012 to 2019. Read the study for full details.
October 6, 2022
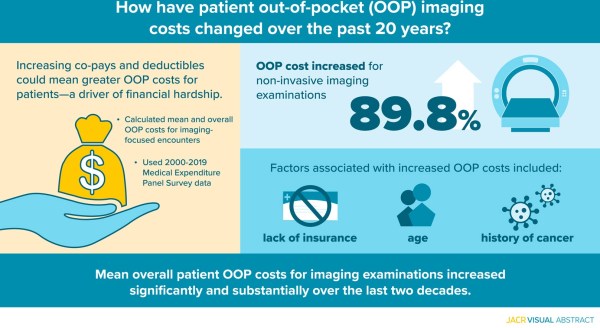
Mean overall patient OOP costs for imaging examinations increased significantly and substantially over the last two decades. Lack of insurance, younger age, history of cancer, and other comorbidities were associated with higher OOP costs. As diagnostic imaging utilization increases, patient financial hardship considerations merit further attention. Read the study for full details.
August 22, 2022
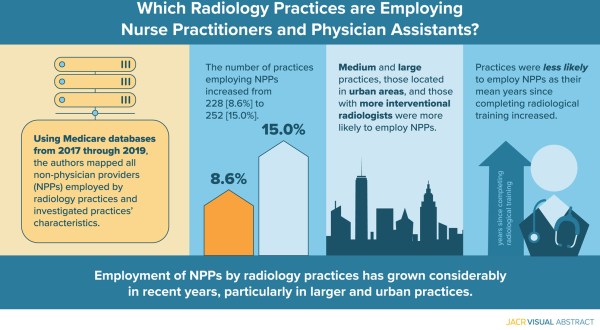
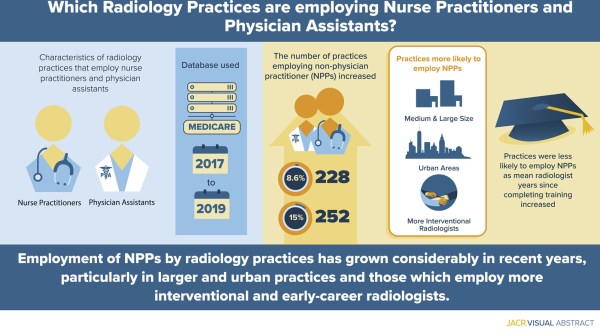
Employment of NPPs by radiology practices has grown considerably in recent years, particularly in larger and urban practices.
July 1, 2022
Neuroimaging continues to increase in the Medicare population. However, disparities exist across demographic groups. Read the study for full details.
March 4, 2022
The number and roles of US nonphysician practitioners (NPPs) have expanded considerably, but little is known about their use by radiology practices. The authors assessed characteristics and trends of radiology practices employing Medicare-recognized NPPs.
March 19, 2021
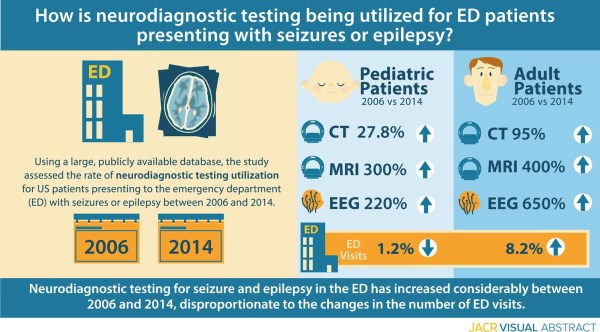
The aim of this study was to assess neurodiagnostic testing utilization in US emergency department (ED) patients presenting with seizures or epilepsy between 2006 and 2014.
January 11, 2021
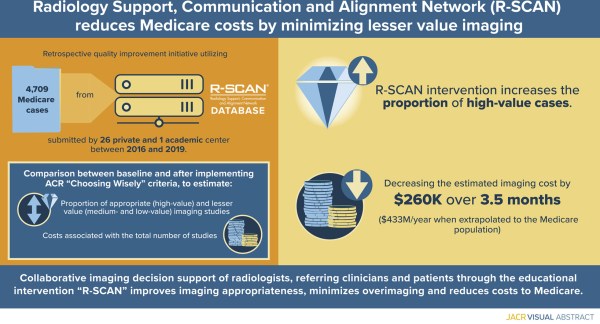
The Radiology Support, Communication and Alignment Network (R-SCAN) is a quality improvement program through which patients, referring clinicians, and radiologists collaborate to improve imaging appropriateness based on Choosing Wisely recommendations and ACR Appropriateness Criteria. In the current study, we aimed to estimate the potential imaging cost savings associated with R-SCAN use for the Medicare population. View Infographic
November 29, 2020
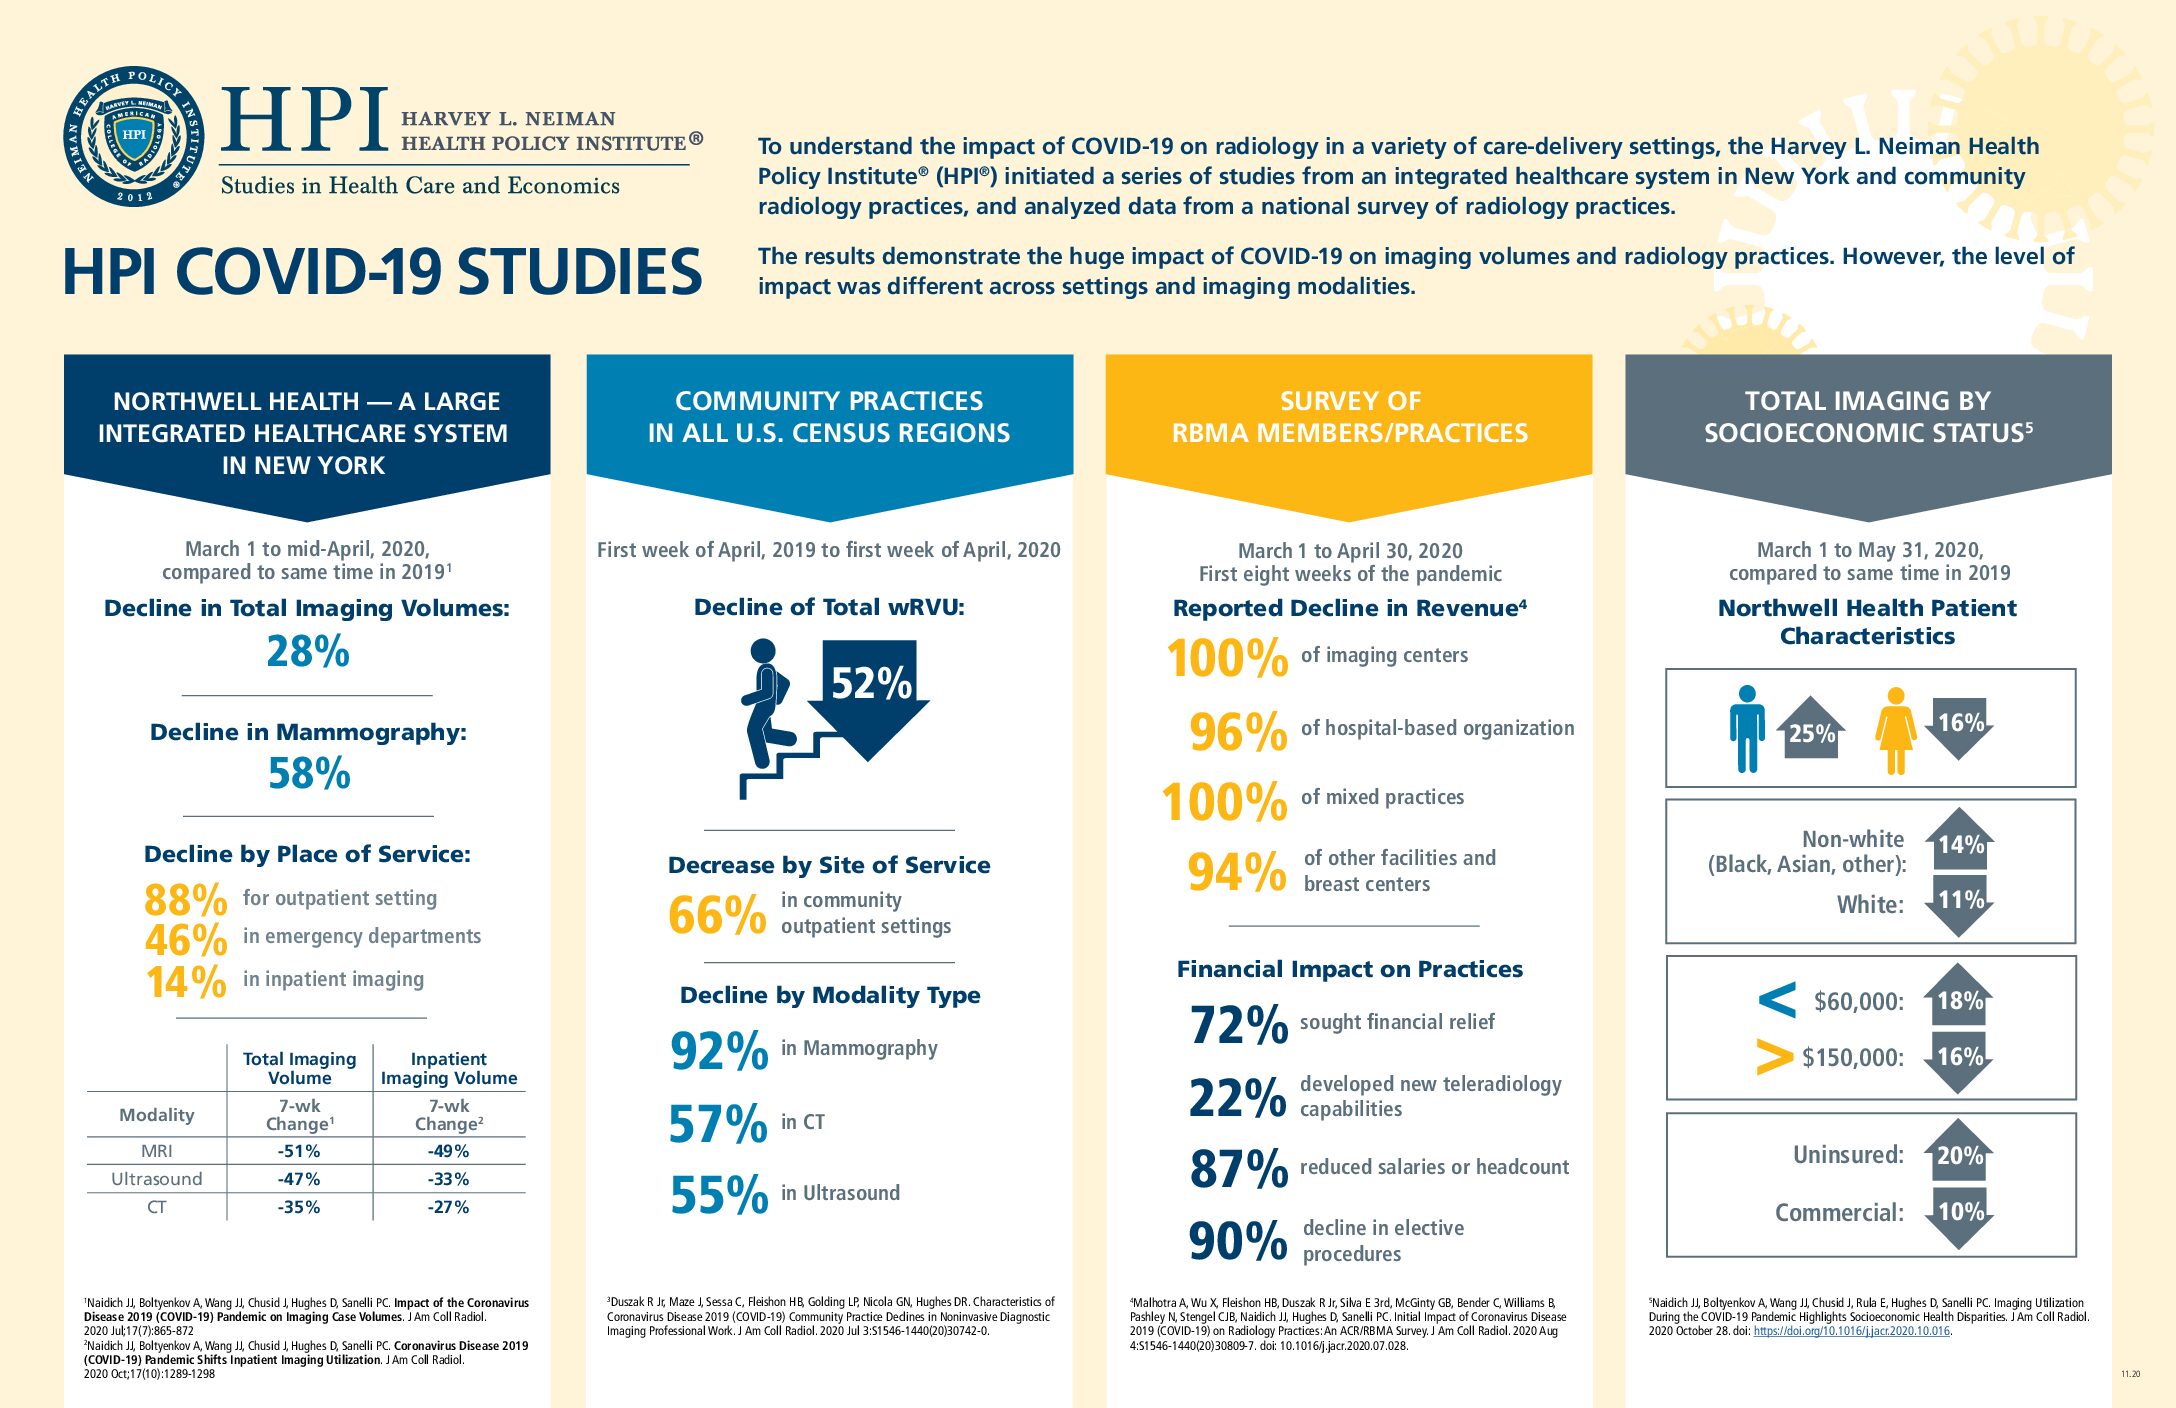
To understand the impact of COVID-19 on radiology in a variety of care-delivery settings, the Harvey L. Neiman Health Policy Institute (HPI®) initiated a series of studies from an integrated healthcare system in New York and community radiology practices, and analyzed data from a national survey of radiology practices. View the infographic to see how COVID-19 affected imaging volumes and radiology practices. View Infographic
November 13, 2020
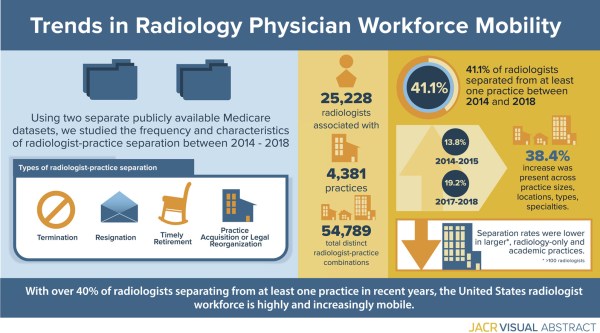
Using two separate publicly available Medicare datasets, the researchers studied the frequency and characteristics of radiologist-practice separation between 2014 – 2018. View Infographic