ICE-T Inpatient Cost Evaluation Tool
Case 2: Examining CJR Episodes
Esteemed Radiology, a fictional radiology group, has partnered with their local hospital and other physician specialty practices to develop bundled payment models so they can participate in the exciting world of value based payments.
The local hospital has asked Esteemed Radiology whether they would like to participate in the Comprehensive Care for Joint Replacement (CJR) model. Although this is a retrospective payment model that places all of the risk and reward on the hospital, Esteemed Radiology’s leadership decide to examine the data and see if there is room for successful participation.
CMS’s CJR model covers all episodes for DRG469 and DRG470. We will use the Compare tool to examine DRG470, which was found to be the most frequent DRG in Case 1: Which DRG Should a Practice Bundle?
Rather than Compare DRG470 to other DRGs, we will use the Compare tool to examine multiple aspects of DRG 470 by selecting it in each of the four selections along with the selections for Part B Imaging Cost, Part B Imaging Share, Part B Total Cost, and Part A Total Cost for 2013. First, we will examine the boxplots.
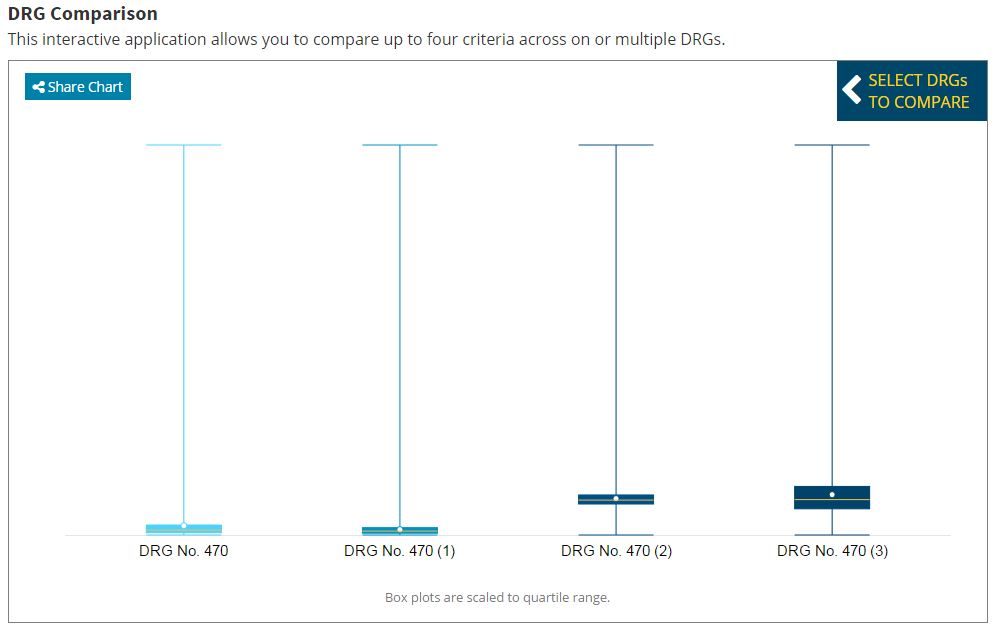
Hovering over the boxplots will present the detailed data associated with the cost item selected. This data is also shown in a table below the legend on the page. The first boxplot indicates there is not a large amount of variation in imaging costs per episode because the shaded box, which displays the interquartile range between the 25th and 75th quartiles, spans a relatively small area on the graph.
However, because the mean episode cost is very close to the 75th quartile, we know there are episodes with very large outliers that expose the radiology practice to considerable risk. By comparison, the third boxplot, which displays the total Part B cost to all providers, shows that the mean episode cost is very close to the median (i.e. 50th quartile) episode cost, indicating that outliers are either much less frequent or much less costly relative to episodes in the interquartile range.
Details on the costs can be found in the table further on the page.
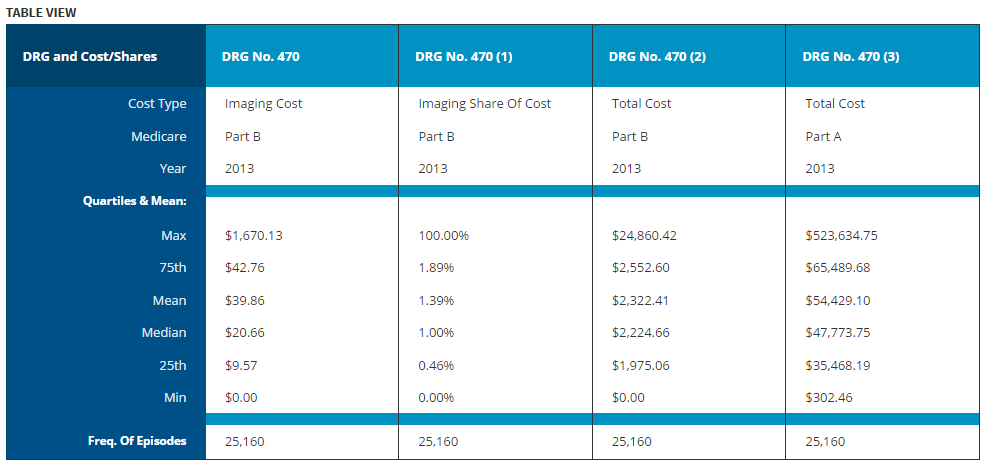
Examining the first column containing data on imaging costs, we see that although the nominal costs are small the interquartile range runs between $9.57 to $42.76 for this DRG. Thus, there may be room to generate savings by better managing imaging utilization. That being said, there were episodes costing as much as $1,670.13. Even though the mean imaging cost of $39.86 provides enough revenue to cover the full cost of all of the outliers, this assumes the individual practice has a large enough volume for their mean episode cost to be very close to that amount.
If Esteemed Radiology desires to propose a mini-bundled flat price that covered all of the imaging for DRG 470 episodes at the hospital, they would need to carefully compare their historical data to the mean cost benchmark of $39.86. If their costs are substantially higher than the mean, Esteemed Radiology would likely prefer to remain “outside” of the bundle and simply continue to receive their fee-for-service reimbursements.
However, if Esteemed Radiology has lower costs that the mean, they may desire to negotiate a bundle price near the mean benchmark of $39.86, or slightly higher to absorb the increased risk of encountering an outlier patient due to their smaller patient volumes. Our Frameworks for Radiology Practice Participation section discusses some of the participation models Esteemed Radiology could consider.
This case provide just one example of how ICE-T’s Compare tool can provide valuable information for developing bundled payment models.